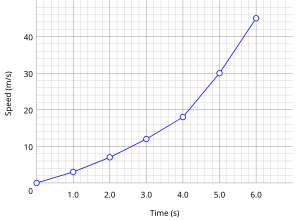
A line chart is the simplest type of chart used to display price data. Line charts are popular because they are easy to read, but they do have limitations that all traders should be aware of. Time or volume—most often time—is on the x-axis of a line chart, and asset price is on the y-axis. The price data is represented by a simple line drawn from left to right. To determine an asset’s price at a given time, a trader simply locates the time of interest on the x-axis, then looks at the price line directly above that time.
Line charts have their limitations. Forming that nice, clean line requires connecting a series of simple, one-dimensional points, where each point represents the asset’s price at a given time. The distance between two points is a time interval during which the asset’s price may have fluctuated significantly. A line chart does not show these fluctuations between points; instead, it assumes that the price transitions smoothly from one point to the next. Other charts, like bar and candlestick charts, do show these fluctuations because bars and candlesticks are built using four distinct prices for each time interval—the high, low, open, and close (HLOC).
Traders who elect to use line charts should be aware of the prices they are being shown. If they choose to use a line chart based on 5-minute time intervals, they should know whether each point in the line shows the high, low, open, or close price during that interval. For instance, a 5-minute stock chart built on opening prices for each time interval will not show the correct closing price for the day, because the line will end not at the end of the last minute of the trading day, but at the beginning of the last 5-minute interval.
Since they are so easy to read, line charts are great for anyone interested in studying the general behavior of a market. Long-term investors will find line charts adequate because their market activities often do not require a high degree of precision. Short-term investors or traders—a group that includes most binary option traders—will prefer bar or candlestick charts because short-term market decisions require higher data resolution for greater overall precision.

No hay comentarios:
Publicar un comentario