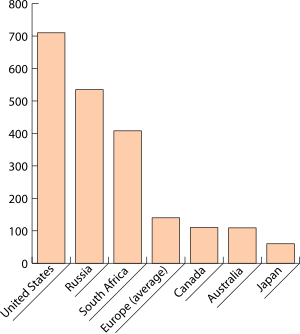
- Bar Chart via Wikipedia
A bar chart is another visually simple type of chart used to display price data. Bar charts lack some of the crisp clarity of a line chart, but they display more price information and are thus more valuable to the typical binary option trader, who needs charts with high data resolution for his short-term trading ideas and execution. On a bar chart, time is plotted on the x-axis and price is plotted on the y-axis. A five-minute bar chart contains bars that each represent five minutes of trading. A daily bar chart contains bars that each represent one day of trading. Bars are situated side-by-side on a chart, moving up and down from left to right to indicate changing prices. A standard bar on a bar chart represents all the trading activity that has taken place during a specified time interval; it shows the high, low, open, and close (HLOC), thus revealing all of the prices that occurred during the the period it covers. Traders who do not want or need quite so much information can usually customize the bars so that they do not show the highs and lows or the opening and closing prices. A bar consists of a vertical line that covers the entire range of prices at which an asset traded during the time interval the bar represents. The top of the vertical line shows the highest price during that interval; the bottom of the vertical line shows the lowest price during that interval. Connected to the vertical line are two small horizontal dashes, one jutting to the left and one jutting to the right. The dash that juts to the left indicates the price at the opening of the bar’s time interval; the dash that juts to the right indicates the price at the close.
No hay comentarios:
Publicar un comentario